
Companies that invest $1,500 or more per employee each year in training enjoy 24% higher profit margins than those with lower investments, according to HR Magazine. Yet for many organizations, training remains a formality. And most employers rarely ask whether employees are satisfied with the experience, let alone track the training satisfaction rate, one of the most important L&D KPIs.
That silence comes at a cost. According to recent research, only 23% of U.S. workers say they’re not very or not at all satisfied with the training opportunities at their jobs.
This means the majority of the workforce is struggling through training programs that don’t inspire or help them. In a business landscape defined by change, skills gaps, and rising employee expectations, not measuring the training satisfaction rate is a missed opportunity.
Why Training Satisfaction Rate Matters
Understanding training satisfaction rate means more than collecting feedback. It shows what’s working (and what isn’t) and helps guide the next steps for improving and expanding the training experience.
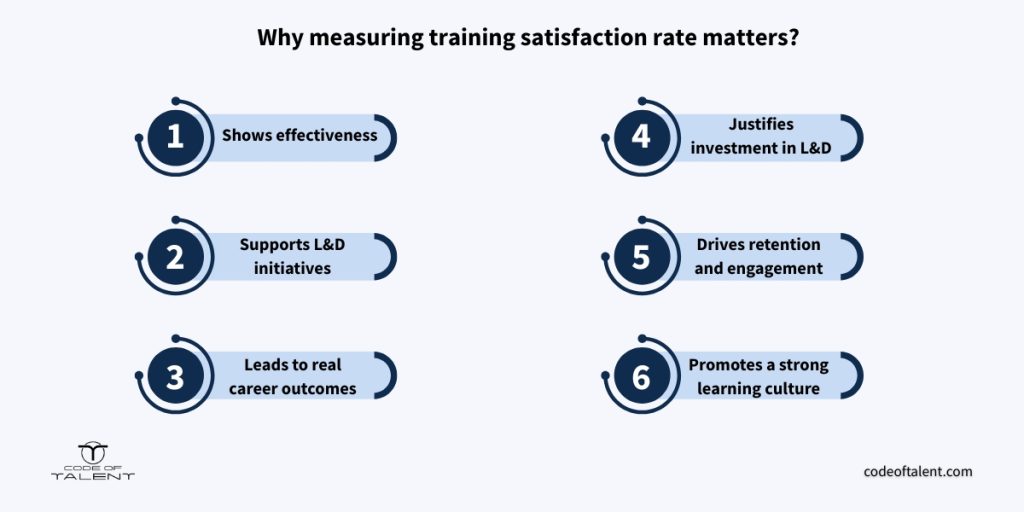
1. Reflects Effectiveness
The training satisfaction rate offers a real-time pulse check on whether training met learners’ expectations. It helps assess:
- If the content is clear and relevant
- If the delivery methods are working
- If the learning objectives are perceived as met
2. Supports Continuous Improvement
Tracking satisfaction allows L&D teams to continuously refine their approach. With ongoing feedback, teams can:
- Identify and correct weak points in course content
- Adjust formats or delivery styles based on learner preferences
- Monitor trends in satisfaction over time to measure improvements
3. Leads to Real Career Outcomes
Employees who are satisfied with training often see real benefits in their roles. According to a SurveyMonkey study:
- 59% of the respondents said training improves their overall job performance
- 51% reported increased self-confidence
- 41% said training helps their time management skills
- 33% credited training with helping them earn a raise
4. Justifies Investment in L&D
A strong training satisfaction rate helps prove to company executives that L&D initiatives are delivering value. This metric:
- Demonstrates ROI by using employee feedback as evidence
- Justifies continuing or increasing funding for training programs
- Supports data-driven decisions in HR and development strategies
5. Drives Employee Engagement and Retention
Employees are more likely to stay at companies that invest in quality training. A high training satisfaction rate contributes to:
- Greater trust in the company’s commitment to growth
- Higher levels of employee engagement
- Better retention: According to Deloitte, retention and engagement numbers are 30% to 50% higher in organizations with strong learning cultures
6. Encourages a Strong Learning Culture
A satisfied learner is more likely to become a motivated learner. A strong training satisfaction rate helps build a culture where:
- Employees feel motivated to pursue growth opportunities
- Learning becomes a valued part of the employee experience
- Continuous development is widely seen as essential. According to LinkedIn, 91% of L&D professionals agree it’s key to career success.
Key Factors That Influence Training Satisfaction
These are the core factors that most influence how employees rate their training experience:
- Relevant Content: Training is most effective when it’s directly tied to job tasks or goals.
According to recent statistics, 91% of employees say training should be relevant and personalized. - Trainer Quality: A skilled trainer makes all the difference. Clear explanations, energy, and responsiveness keep participants engaged and improve satisfaction.
- Format and Delivery: Interactive formats like simulations or blended learning outperform passive lectures. In 2024, for example, games and simulations became the most-used training method, preferred by 46% of organizations.
- Accessibility and Flexibility: When training is easy to access (on mobile, self-paced, or well-scheduled) people are more likely to complete it and enjoy the experience.
- Opportunities for Practice: Practice turns theory into impact, which leads to deeper learning and higher satisfaction.
- Post-Training Support: Resources, follow-ups, and coaching after the session help people retain and apply what they learned.
- Learning Culture: A company that values growth encourages employees to take training seriously.
How to Accurately Measure Training Satisfaction
To gather meaningful feedback, organizations need to evaluate multiple aspects of the learning experience, from content and delivery to engagement and support.
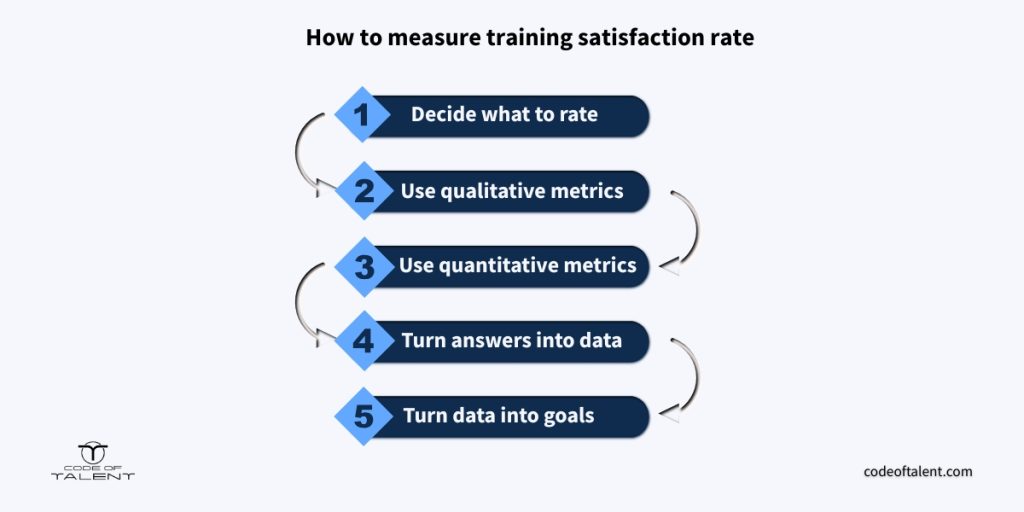
Step I: Identify Key Elements to Rate
Use the following categories to assess the full training experience. Each plays a role in shaping participant satisfaction and can reveal important patterns in your feedback data:
Category | What to Evaluate |
Training Format | Was it engaging (e.g., interactive, hands-on, blended)? Did the format suit the topic and audience (e.g., virtual vs. in-person)? |
Training Content | Was the material relevant, up-to-date, and practical? Did it meet the learning objectives? |
Trainer / Presenter / Facilitator | Was the trainer knowledgeable, engaging, and clear? Did they encourage participation and handle questions well? |
Training Platform or Tool | Was the platform easy to navigate? Were there any technical issues? |
Learning Materials & Resources | Were resources helpful and well-organized? |
Interactivity and Engagement | Were there activities, breakout sessions, polls, or discussions that kept learners involved? |
Pacing and Time Management | Was the training well-paced? Was the duration appropriate for the content? |
Assessment and Feedback Mechanisms | Were there quizzes, evaluations, or feedback loops to reinforce learning? |
Relevance to Job Role | Did the training feel applicable to the participant’s daily tasks or responsibilities? |
Post-Training Support | Were there follow-up resources, Q&A sessions, or access to a learning community? |
Overall Satisfaction | Would the participant recommend the training to others? Did the training meet or exceed expectations? |
Step II: Use Qualitative Metrics to Measure Training Satisfaction Rate
While quantitative scores help track trends, qualitative feedback offers the context behind the numbers. Here are 10 valuable qualitative methods to consider:
1. Open-Ended Questions
- How: Collect comments on what participants liked, disliked, or would improve
- Why: These kind of questions reveal nuances that rating scales can’t capture
- Tip: Avoid leading questions that suggest a “correct” answer. For example, asking “Would you say this training was insightful?” can influence participants to agree, even if they don’t feel that way. Instead, use neutral wording to encourage honest feedback. “Describe these training sessions in five words.” gives the respondent more options to express themselves.
- Sample question: “What was the most valuable part of the training for you?”
2. Observed Behavior Changes (Post-Training)
- How: Have managers or supervisors assess whether new skills are being applied
- Why: Observations help confirm if training outcomes are translating to real job performance
- Tip: Use structured check-ins or observation forms to make feedback consistent and actionable
- Sample prompt: “Since the training, have you noticed any changes in how [employee] handles tasks or collaborates?”
3. Learner’s Confidence
- How: Ask participants how confident they feel using what they learned
- Why: Confidence is often the first sign of readiness to apply new skills
- Tip: Track self-assessed confidence before and after training
- Sample question: “How has this training changed the way you approach your work?”
4. Peer or Manager Testimonials
- How: Gather feedback from colleagues or supervisors about visible changes in behavior or performance
- Why: External perspectives add credibility
- Tip: Keep the feedback focused: ask for one specific improvement they’ve noticed
- Sample question: “What’s one thing [employee] is doing differently since the training?
5. Success Stories
- How: Document personal anecdotes or case studies showing how training led to real-world results
- Why: Stories illustrate value in ways data alone can’t
- Tip: Ask participants to describe a challenge they overcame using what they learned
- Sample prompt: “Can you share an example of how this training helped you solve a problem at work?”
6. Engagement Behaviors
- How: Have facilitators observe and note participation, questions, and attention levels
- Why: High engagement often indicates content is relevant and well-delivered
- Tip: Use a checklist or short post-session debrief for trainers to document engagement patterns
- Sample observation: “Most participants asked questions and stayed active in breakout sessions.”
7. Applicability and Relevance
- How: Ask learners if the content matched their job needs or career goals
- Why: Relevance strongly influences satisfaction and retention
- Tip: Include this question post-training and during follow-up check-ins
- Sample question: “How applicable was this training to your day-to-day responsibilities?”
8. Post-Training Reflection Exercises
- How: Encourage short written reflections or journal-style entries
- Why: These responses show what stood out and what learners internalized
- Tip: Keep the reflection prompts simple and open-ended to encourage honest thought
- Sample prompt: “What’s one key takeaway you’ll apply in your role?”
9. Feedback Channels
- How: Provide participants with clear feedback on how they’re doing, during and after training
- Why: When learners receive meaningful feedback, they feel motivated to improve. Gallup reports that 80% of employees who received meaningful feedback in the past week were fully engaged, showing just how powerful feedback can be in driving learning outcomes and satisfaction
- Tip: Incorporate small checkpoints like quizzes, live coaching, or post-session comments
- Sample prompt: “What feedback did you receive during this training that helped you grow?”
10. Interest for Future Learning
- How: Ask participants about interest in follow-up sessions or new topics
- Why: Ongoing curiosity signals that the training experience was positive and motivating
- Tip: Include a short list of related topics and let learners vote on what they’d like next
- Sample question: “What new skills or topics are you interested in learning more about?”
Step III: Use Quantitative Metrics to Measure Training Satisfaction Rate
While qualitative insights capture the learner’s perspective, quantitative metrics provide measurable data that track progress and outcomes. Together, they offer a complete picture of training satisfaction and effectiveness.
1. Pre- and Post-Training Assessment Scores
- What it means: Tests or quizzes given before and after training sessions to measure learners’ knowledge or skills.
- Why it matters: Shows how much participants have learned or improved because of the training.
- How to track it: Compare scores from assessments taken before and after the training program.
2. Course Completion Rates
- What it means: The percentage of participants who finish the entire training course OR the percentage of training content that one participant finished during a period/session.
- Why it matters: Indicates how engaging or accessible the training is; low completion might signal issues with content or format.
- How to track it: Use reports from your Learning Management System (LMS) or attendance records.
3. Time to Competency
- What it means: The average amount of time it takes participants to reach the desired skill level after training.
- Why it matters: Helps with workforce planning and assessing the efficiency of training programs.
- How to track it: Monitor progress through skills assessments, performance reviews, or onboarding checklists over time.
4. Employee Productivity Metrics
- What it means: Measurable changes in work quality following training.
- Why it matters: Connects training directly to business results, such as faster task completion or fewer errors.
- How to track it: Analyze relevant KPIs before and after training implementation.
5. Training Attendance Rate
- What it means: The percentage of invited employees who actually participate in the training.
- Why it matters: Reflects employee interest, availability, and accessibility of the training program.
- How to track it: Track enrollment numbers against actual attendance using sign-in sheets or LMS data.
6. Training Satisfaction Score
- What it means: The average rating participants give training through post-session surveys, usually on a scale (e.g., 1 to 5).
- Why it matters: Serves as a core indicator of how satisfied learners are with the content, delivery, and relevance.
- How to track it: Collect data via post-training surveys or evaluation tools.
7. Retention Rate of Learned Material
- What it means: How much training content participants remember after a period of time (weeks or months).
- Why it matters: Measures whether knowledge sticks beyond the training session.
- How to track it: Conduct follow-up quizzes or assessments some weeks after training.
8. Return on Investment (ROI)
- What it means: The financial return generated from training compared to the costs involved.
- Why it matters: Justifies training budgets by showing clear financial benefits like increased sales or reduced errors.
- How to track it: Use the formula: ROI % = ((Training Benefits – Training Costs) ÷ Training Costs) × 100.

9. Promotion or Internal Mobility Rates
- What it means: The frequency at which trained employees are promoted or move into new roles within the organization.
- Why it matters: Reflects training’s impact on career growth and talent development.
- How to track it: Monitor employee movement data through HR systems or talent management software.
10. Reduced Support or Error Incidence
- What it means: A drop in mistakes, customer complaints, or support tickets after training.
- Why it matters: Demonstrates training effectiveness, especially in technical or compliance areas.
- How to track it: Compare incident reports or support data from before and after training.
11. Engagement Scores (Learning Platform Analytics)
- What it means: Data showing how learners interact with digital training content (logins, time spent, module completions).
- Why it matters: Helps understand how engaged learners are with the training materials.
- How to track it: Review LMS or e-learning platform analytics dashboards.
Microlearning platform Code of Talent uses a unique engagement metric called “energy”—a score that reflects how quickly learners complete training missions. Finishing before the deadline results in high energy, while delays reduce the score. Energy can be viewed at both the individual and team level: if one person lags, it lowers the team’s overall score, which encourages teamwork and keeps everyone more motivated to stay on track.
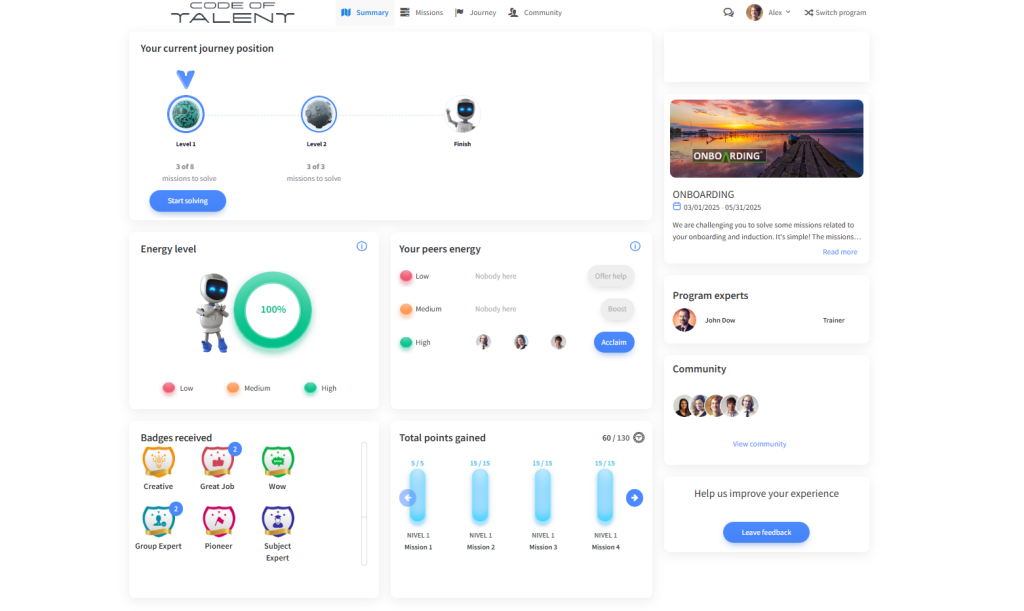
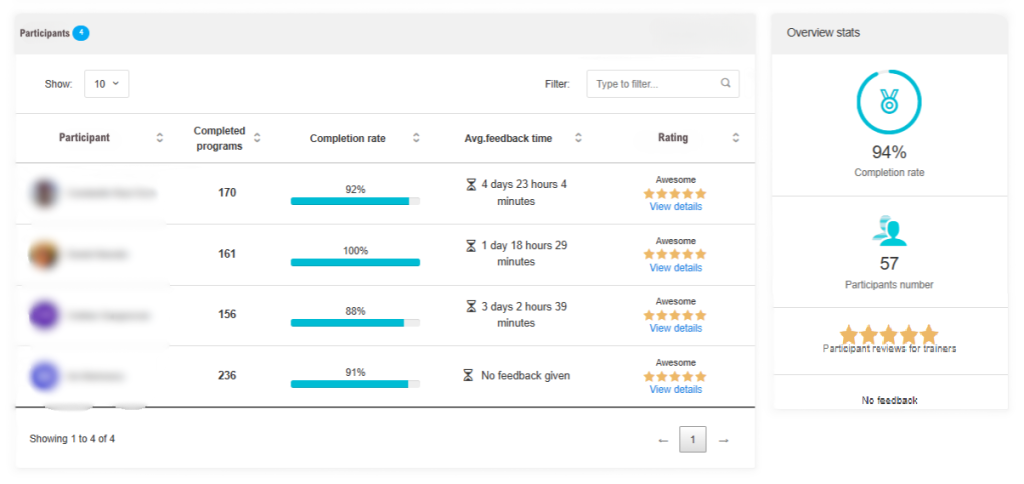
In addition to this dynamic metric, Code of Talent also tracks traditional LMS analytics such as completion rates, quiz performance, and response quality.
Step IV: Transform Answers to Data
Collecting responses is only the beginning. What matters next is how you organize and analyze that feedback, especially when combining numerical ratings with open-ended insights. Here’s how to turn raw responses into structured data:
1. Design Structured Data Collection Tools
Surveys and post-training evaluations should include standardized response formats like Likert scales (e.g., “Rate the clarity of the content from 1 to 5”) and multiple-choice questions. This makes it easier to compare results across sessions, facilitators, or departments.
But don’t rely solely on checkboxes. Open-ended questions are essential for understanding why participants responded a certain way. For example, follow a numeric rating with “What made this training effective for you?” to add context behind the score.
2. Quantify Qualitative Responses
Open-text feedback may feel messy, but it holds rich insights. Categorize responses into themes like:
- Trainer delivery
- Content relevance
- Technical issues
- Interactivity
- Job applicability
Then, analyze how often each theme appears to identify patterns. You can use spreadsheets to manually tag responses or leverage tools like AI-based sentiment analysis to speed things up.
3. Use Rating Scales for Easy Comparison
To simplify subjective feedback, convert it into quantifiable scores. For instance, ask learners to rate their overall experience on a 1–5 or 1–10 scale. Once collected, calculate:
- Averages for a quick snapshot
- Medians to reduce the impact of outliers
- Score distribution to see how widely opinions vary
4. Leverage Learning Analytics Platforms
Modern LMS and digital training tools automatically collect useful data points, such as:
- Completion rates
- Quiz scores
- Time spent per module
- Log-in frequency
- Clicks and navigation flow
5. Create Dashboards and Visual Reports
Once you’ve collected and organized your data, bring it to life through visualization. Use tools like Power BI, Tableau, or Google Data Studio to build dashboards that highlight:
- Satisfaction trends over time
- Correlation between engagement and quiz performance
- Training effectiveness by topic or facilitator
Step V: Transform Data into Goals and Action Items
Once training satisfaction data is collected and organized, the next step is turning that insight into concrete improvements. This transformation moves feedback from passive observation to action.
1. Summarize Insights for Action
Look through your data to create concise summaries that identify strengths and weaknesses.
2. Analyze Data to Identify Key Themes and Issues
Use both numeric and narrative data to detect recurring challenges or opportunities. For example, low ratings for “trainer clarity” may be backed up by comments about confusing delivery styles.
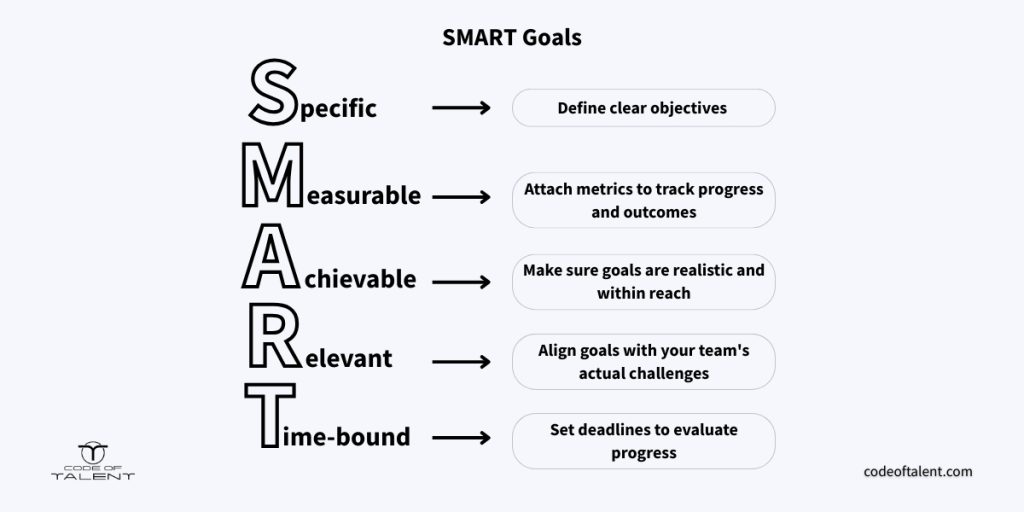
3. Set SMART Goals
Turn identified issues into SMART goals (Specific, Measurable, Achievable, Relevant, Time-bound). This keeps your response focused and outcomes easier to measure.
- Example: “Increase average satisfaction score for trainer clarity from 3.5 to 4.5 by the end of Q4.”
4. Sort Goals According to Importance and Urgency
Not all improvements need to be immediate. Choose actions that will make the biggest difference and balance them with what’s realistic.
5. Define Clear Action Steps
Translate goals into concrete tasks, with timelines and ownership clearly assigned.
Example:
- Revise slide decks to simplify complex concepts
- Owner: Instructional Designer
- Due: In 2 weeks
6. Implement Changes and Monitor Progress
Put your plans into action and track how those changes affect future satisfaction scores, performance outcomes, or learner feedback.
Proven Strategies to Boost Training Satisfaction Rates
Improving training satisfaction doesn’t have to mean overhauling your entire learning strategy. Sometimes, small changes can make a big impact. These proven techniques help make training more enjoyable and effective for employees.
Make it Engaging: Gamification
Gamification means using elements from games, like points, badges, levels, timers, or leaderboards, inside a training program. It taps into the same psychological tricks that make video games addictive: competition, instant rewards, and visible progress.
For training, this approach improves motivation and focus. When people can see how they rank against others, they stay more engaged and want to succeed, even when it’s something as simple as a training mission. It also turns passive learners into active participants.
Gamification works because it speaks to something basic in human nature: we like to win and be recognized.
Make it Shorter but Punchier: Microlearning
Microlearning is a simple solution to a modern problem: shrinking attention spans. Long training sessions can cause people to tune out. Microlearning breaks training into bite-sized lessons (usually under 10 minutes) that focus on one topic or skill at a time.
This approach respects people’s time, reduces cognitive overload, and makes it easier to fit learning into the workday. And when lessons are short and to the point, learners are more likely to finish them and enjoy the experience.
Make it Sociable: Collaborative Learning
Learning is more powerful when it’s shared. Adding social features like group discussions, peer feedback, or Q&A threads helps people learn from each other, not just the trainer. It also encourages people to practice giving feedback and step into a mentoring role, something many find personally rewarding.
In fact, learners who use social tools like Q&A, course shares, and learning groups watch 30 times more learning content than those who don’t, according to LinkedIn Learning.
Make it Rewardable: Small Milestones
Everyone likes to feel recognized. Offering rewards, like certificates, shout-outs, or small incentives, for completing training can boost motivation and show that learning is valued by the organization.
It doesn’t have to be flashy. Even simple recognition helps people feel proud of their progress and more satisfied with the training experience.
How to Use Code of Talent to Improve Training Satisfaction Rate
Improving your training satisfaction rate starts with using the right tools, and Code of Talent is built for just that. From customizable microlearning modules and gamified experiences to collaborative learning spaces and real-time feedback options, every feature is designed to keep learners engaged, motivated, and progressing.
The platform tracks completion, engagement, and response quality automatically, while its unique “energy” metric adds a layer of team accountability.
Whether you’re just starting or looking to optimize existing programs, Code of Talent gives you the flexibility, insights, and automation to build better learning journeys.
Start your free trial today and see how easy it is to raise your training satisfaction rate with Code of Talent.
Cover photo: Freepik